Usage View  
In Usage View, you can monitor your tier metrics and their state upon thresholds. Tier metrics are defined by:
- number of devices (Devices) you can manage
- bandwidth (Data Transfer) for uploading and deploying artifacts
- storage (File Storage) to keep your update artifacts in Update Factory data store.
You will have those metrics details displayed in the Usage section of your dashboard as shown in Figure 1.
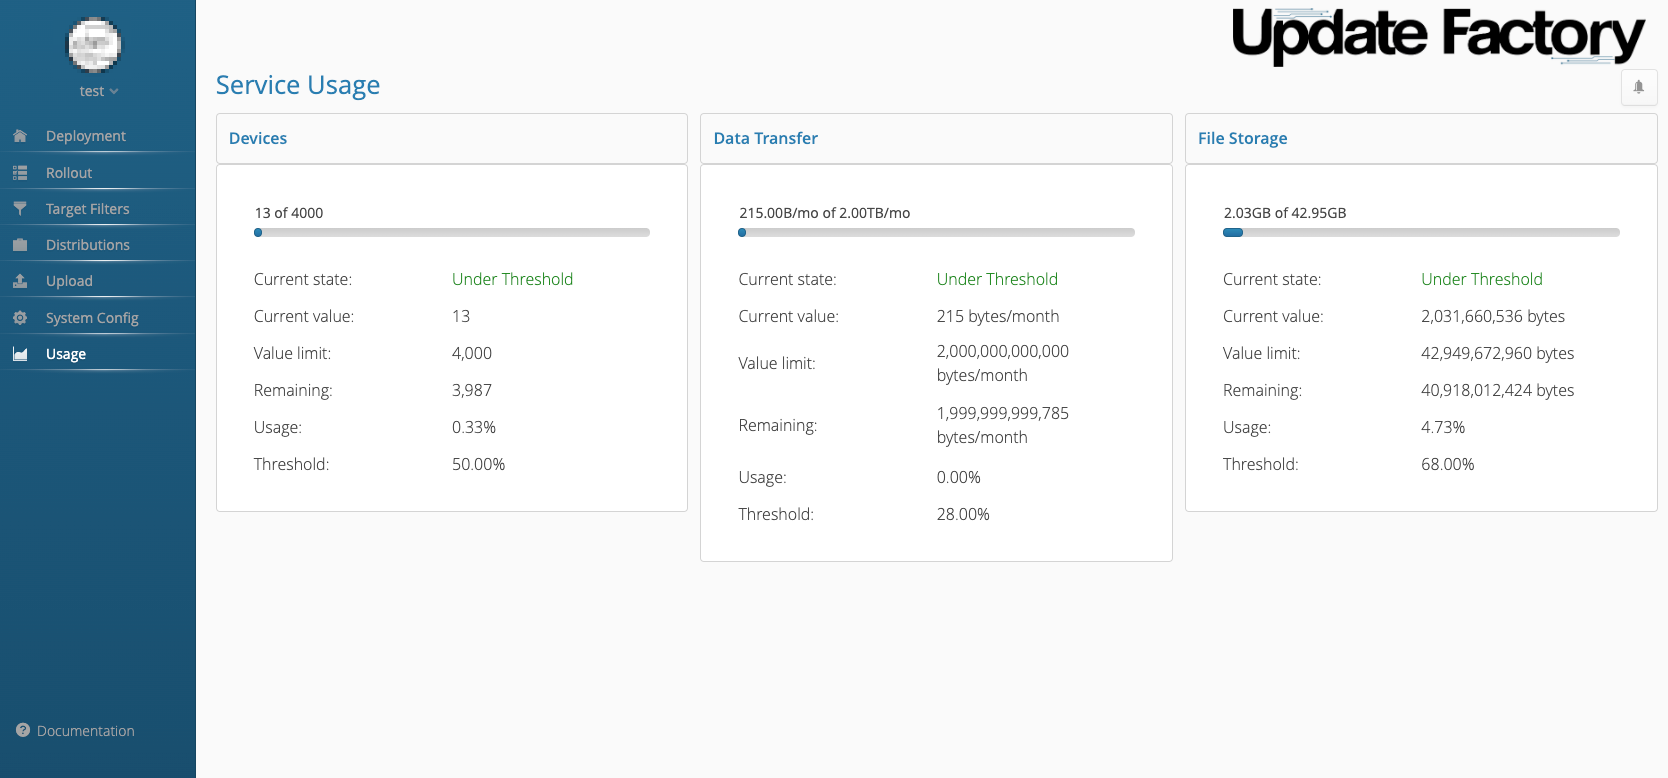
Figure 1
The Service Usage provides:
- how many devices you have allocated
- how much data you have transferred
- how much storage you have used
Thresholds can be set in System Configuration page. You can tune metric state-changes which can vary between:
- Under Threshold (green)
- Over Threshold (orange)
- Limit Exceed (red)
Every metric provides:
- current state: shows one of the three states as per above definition which are triggered by the threshold value.
- current value: shows the current value of the metric
- value limit: is the limit of defined by your tier
- remaining: provides the difference between the limit and the current state
- usage: provide the current percentage with respect the limit
- threshold: is the threshold value set for the metric in the System Configuration